Circle Time: Math and Anchor Charting
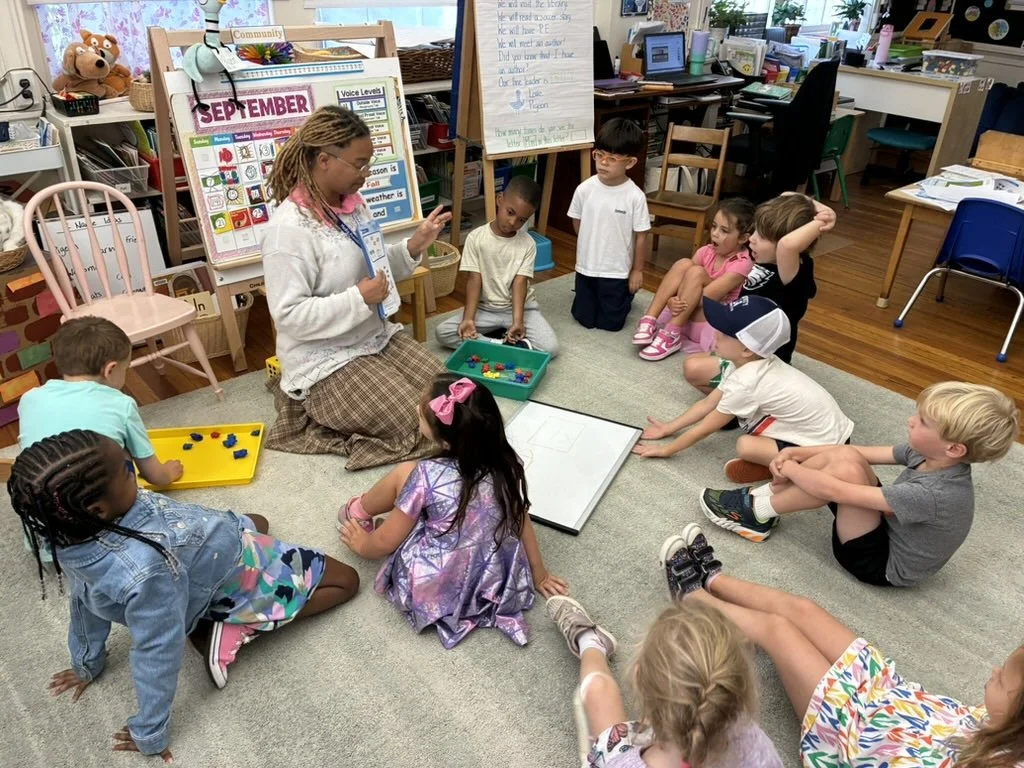
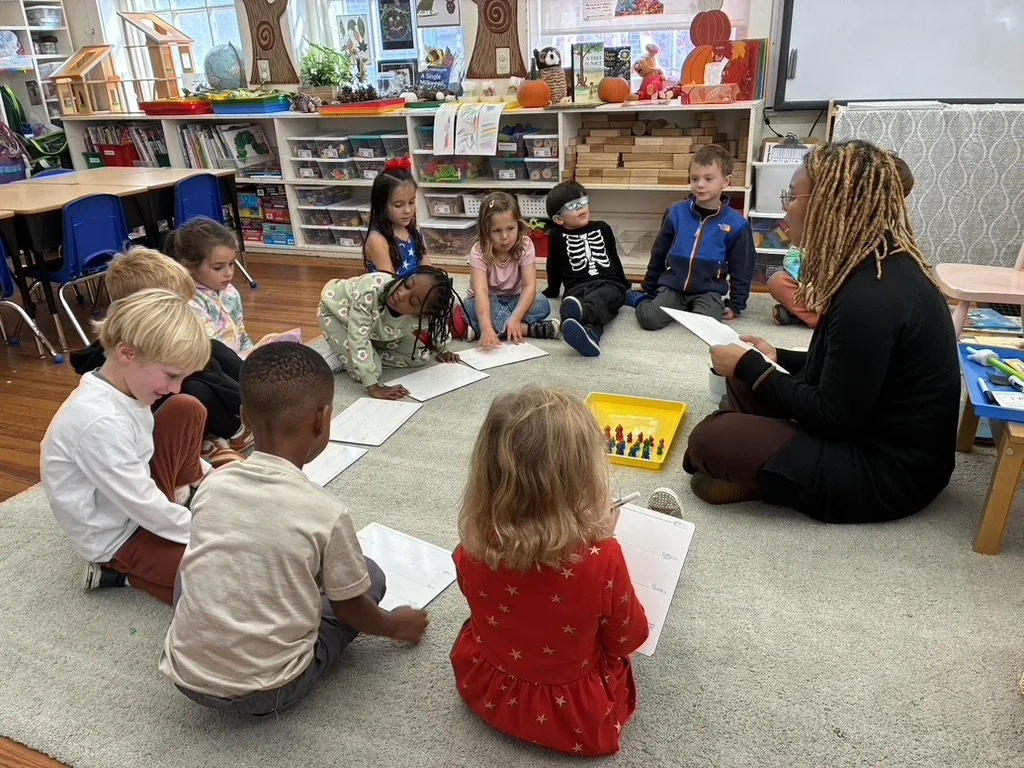
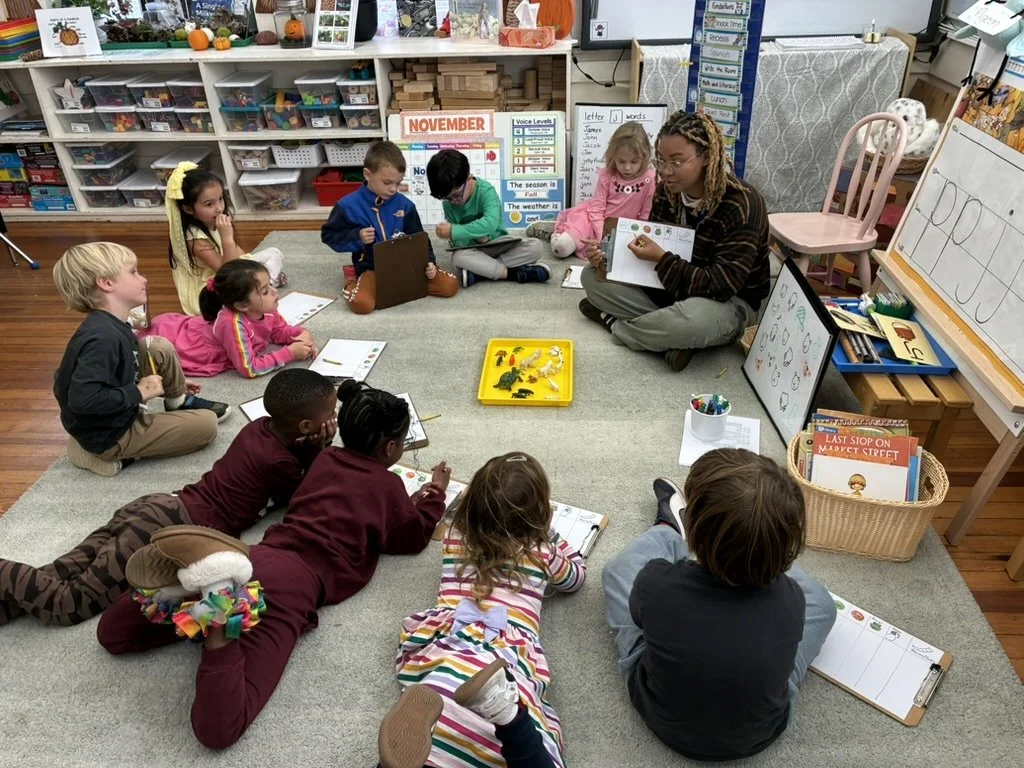
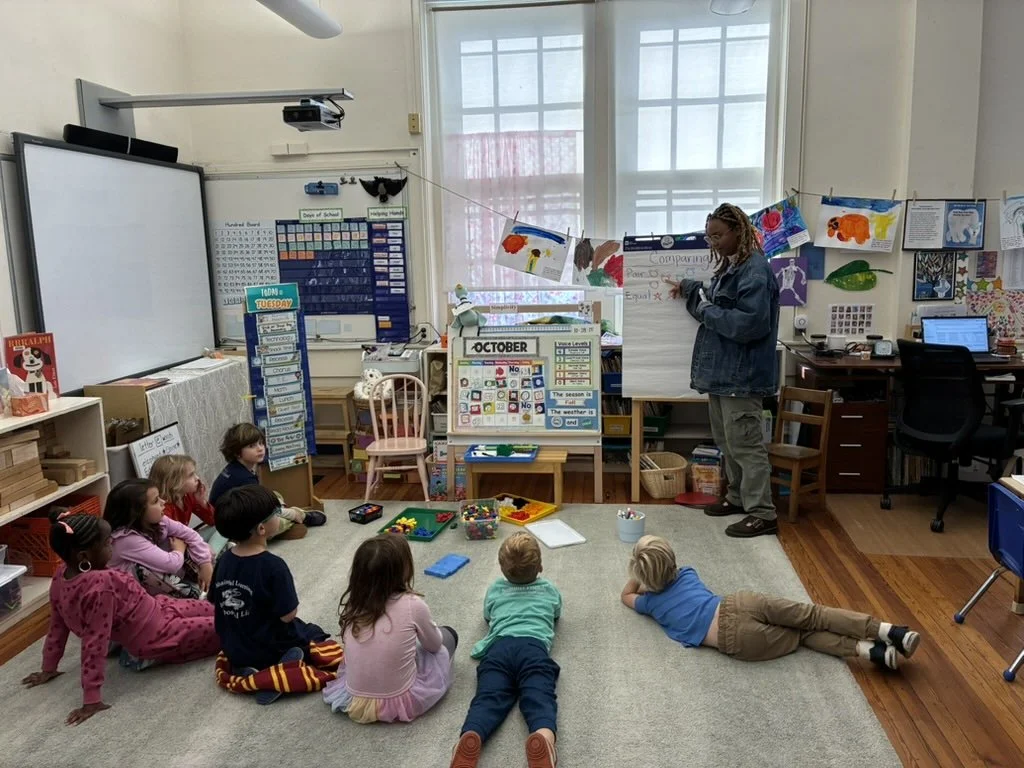
One of the most meaningful instructional strategies I explored during student teaching was introducing anchor charting into our kindergarten math time on the carpet. Anchor charting is really the process of capturing students’ thinking in real time and turning it into a visual reference that remains accessible long after the lesson ends. In kindergarten, where so much learning is hands on and language building, anchor charts help make abstract ideas visible and concrete.
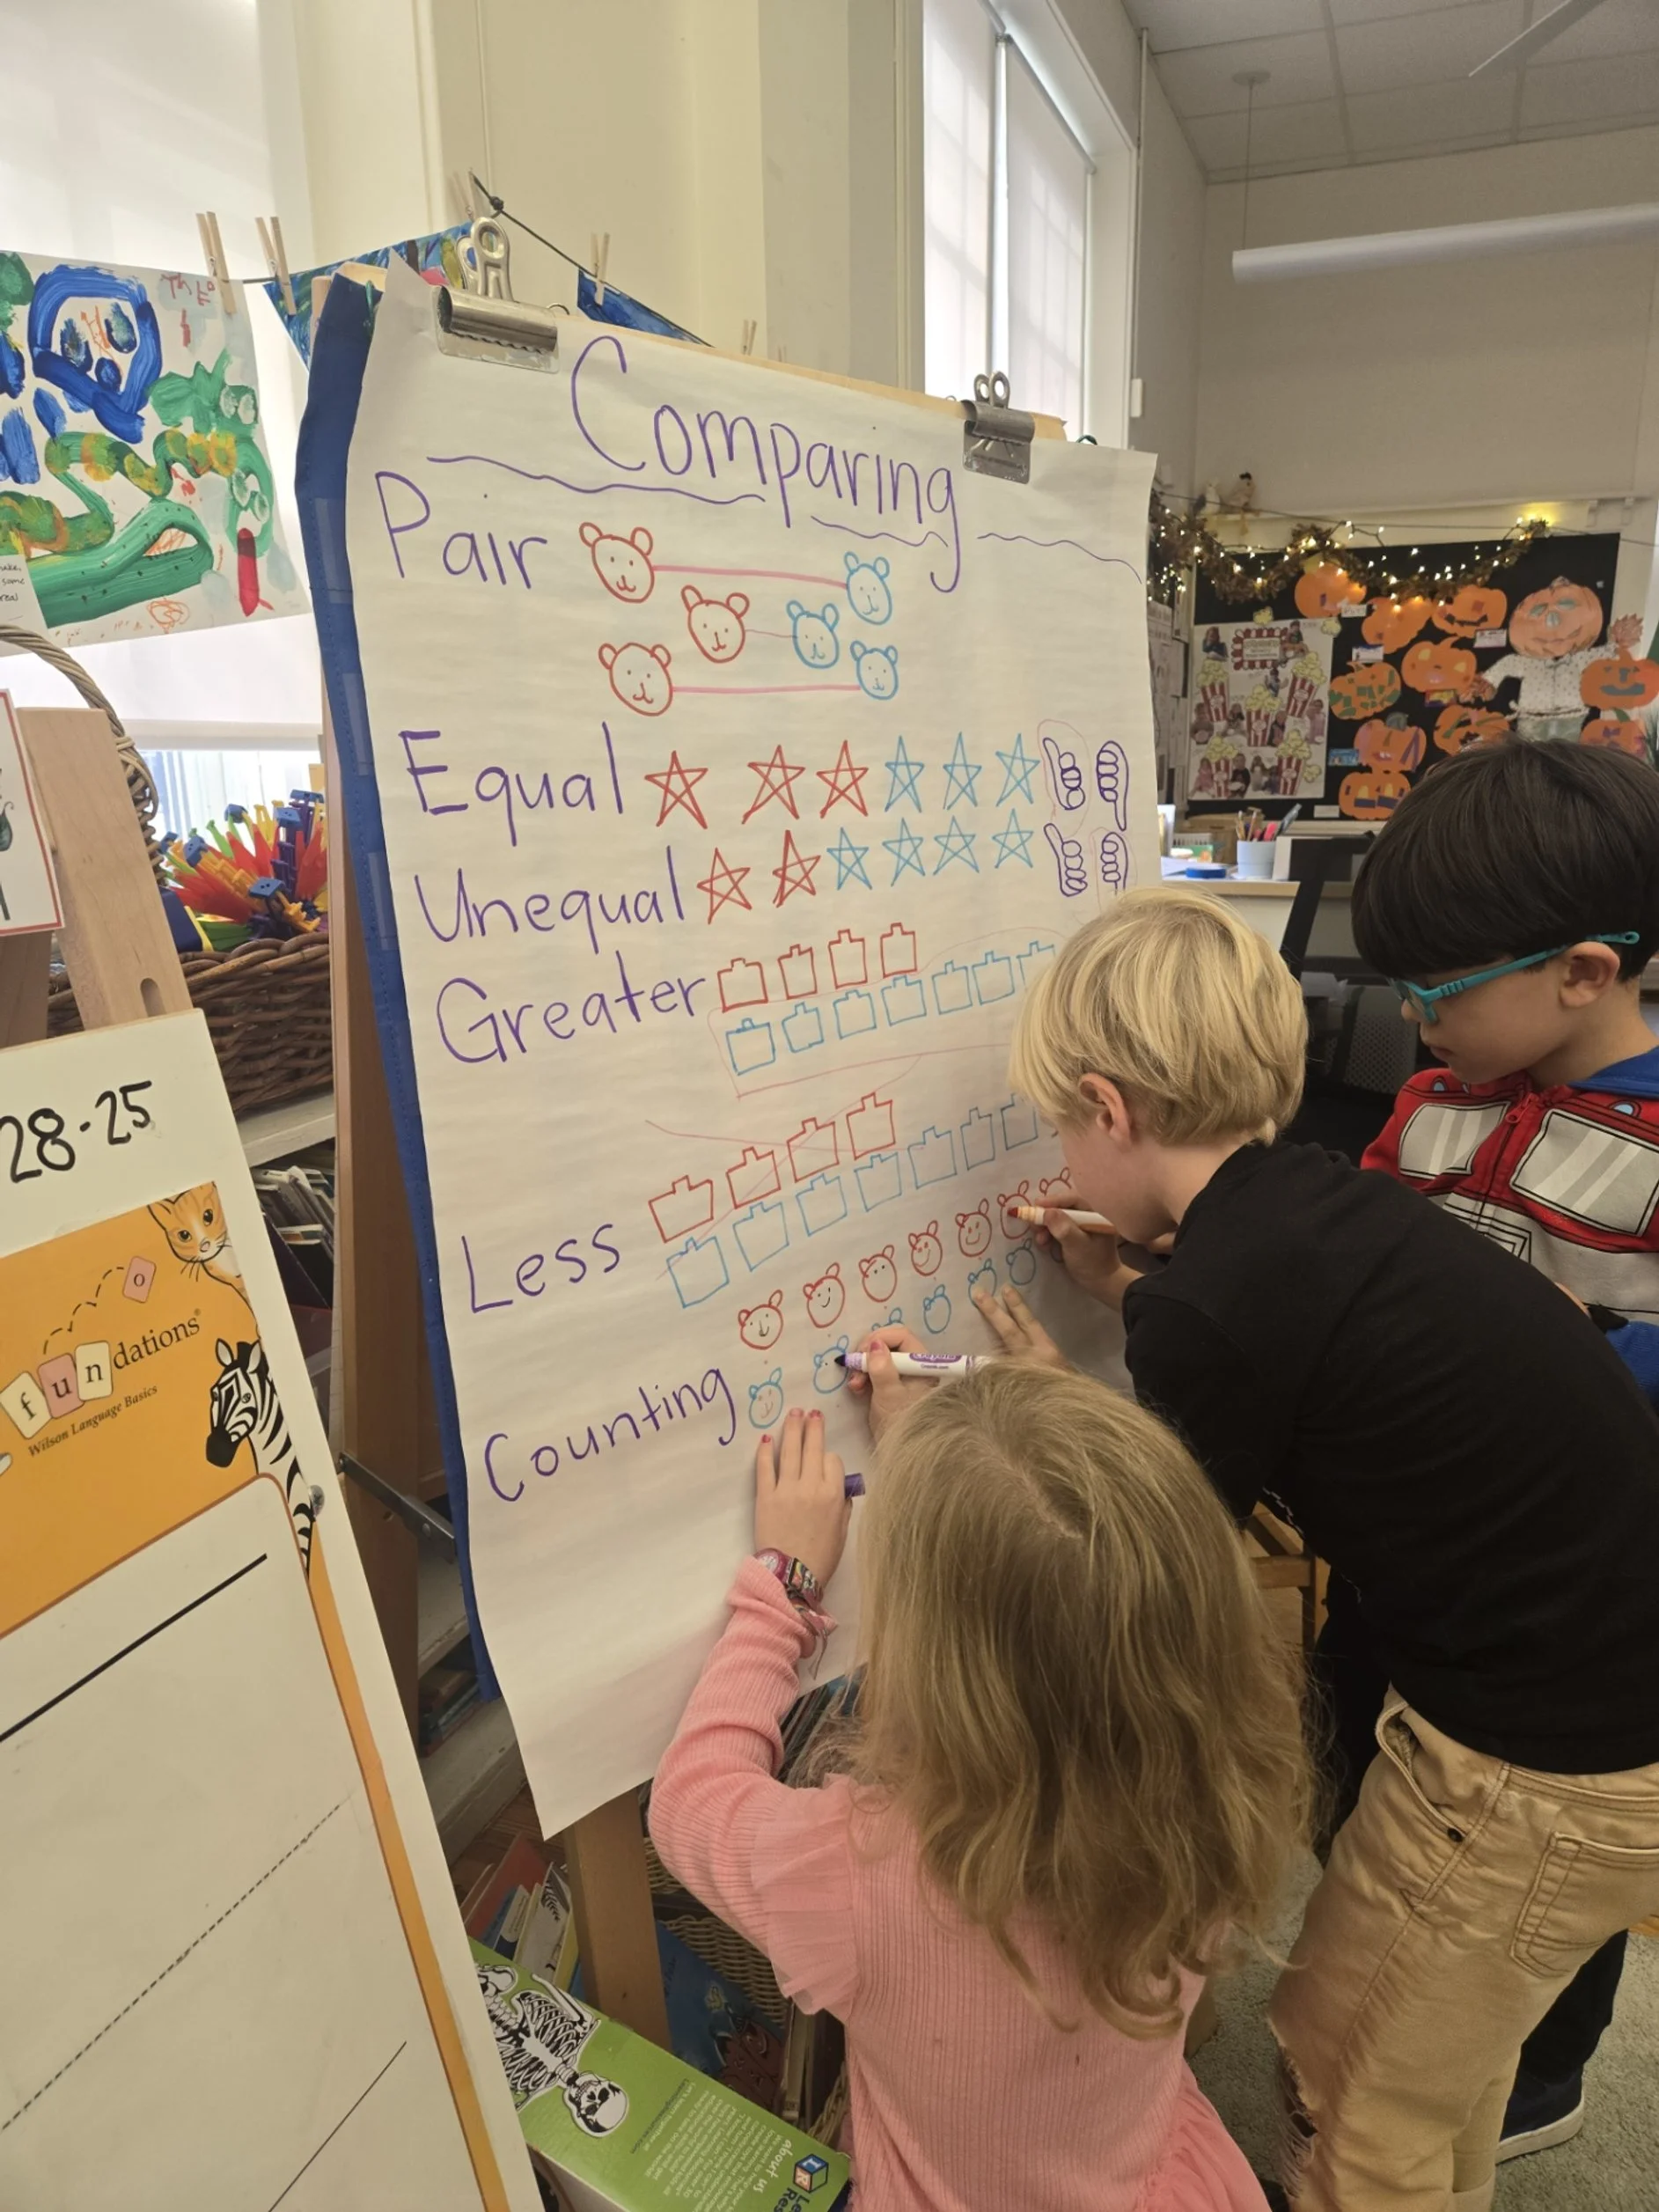
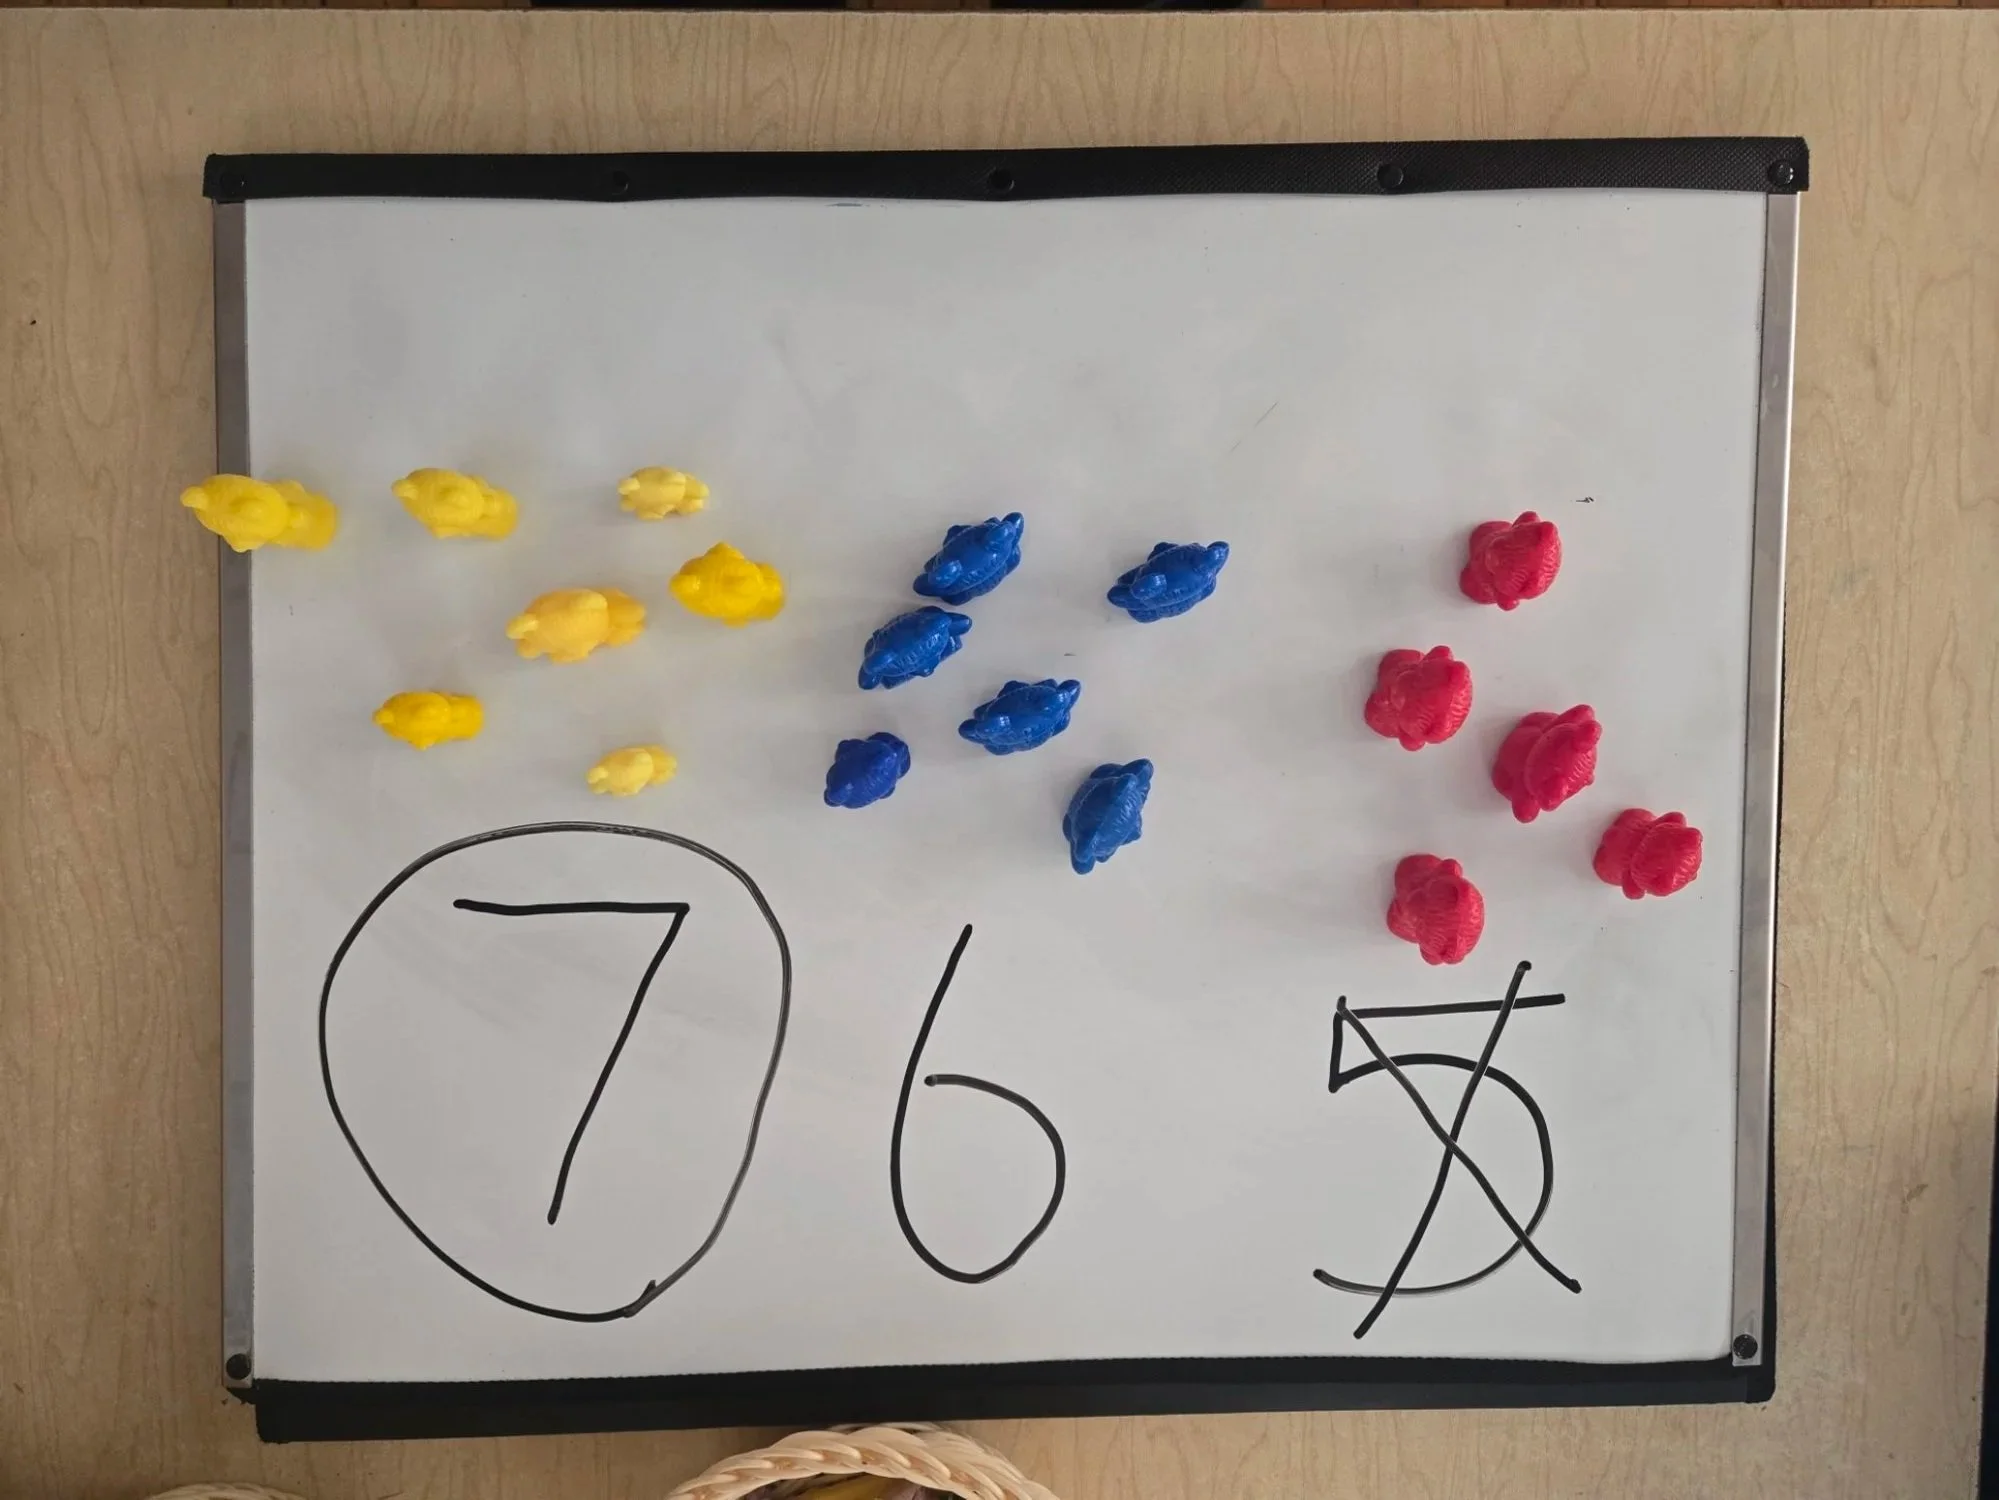
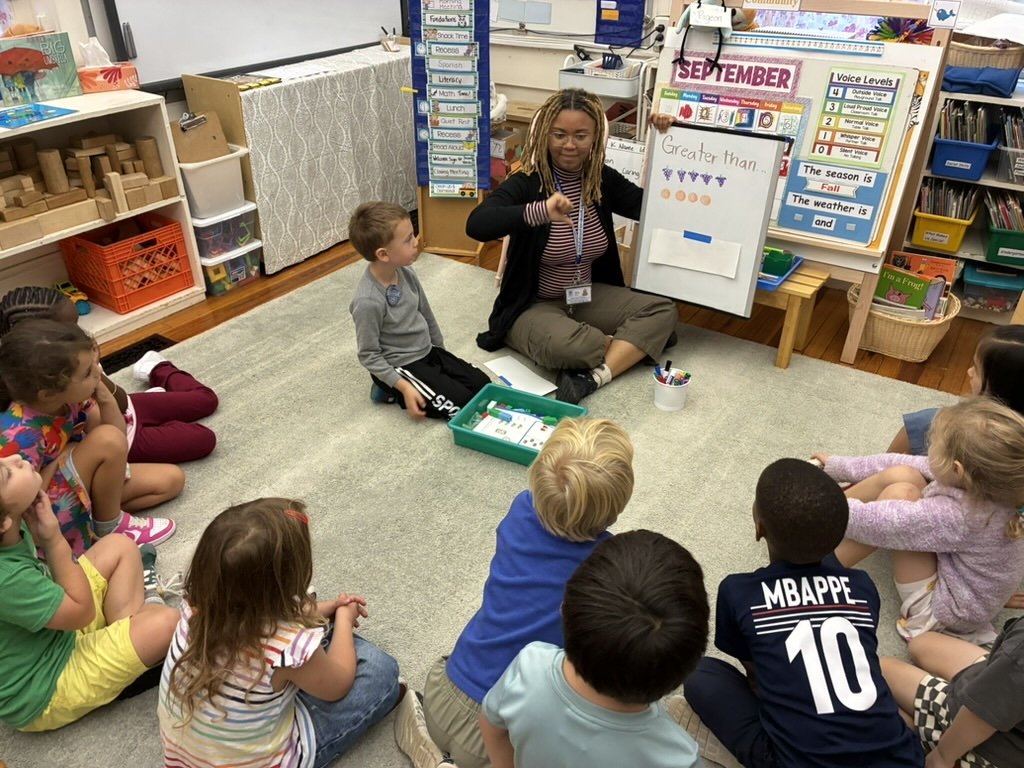
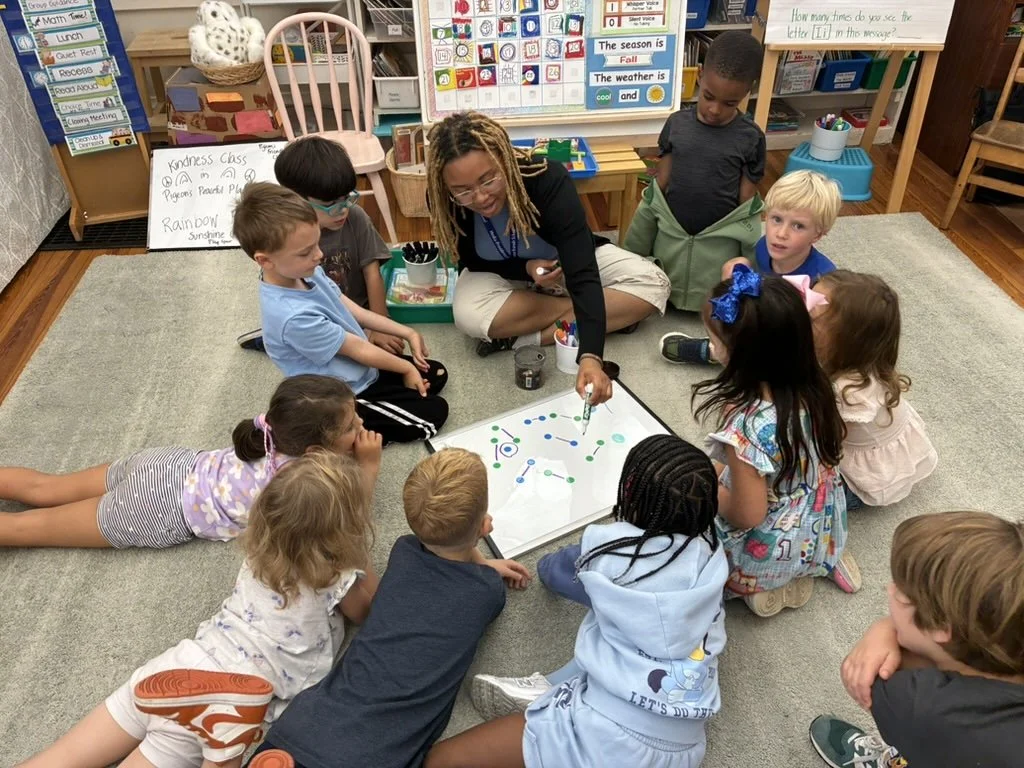
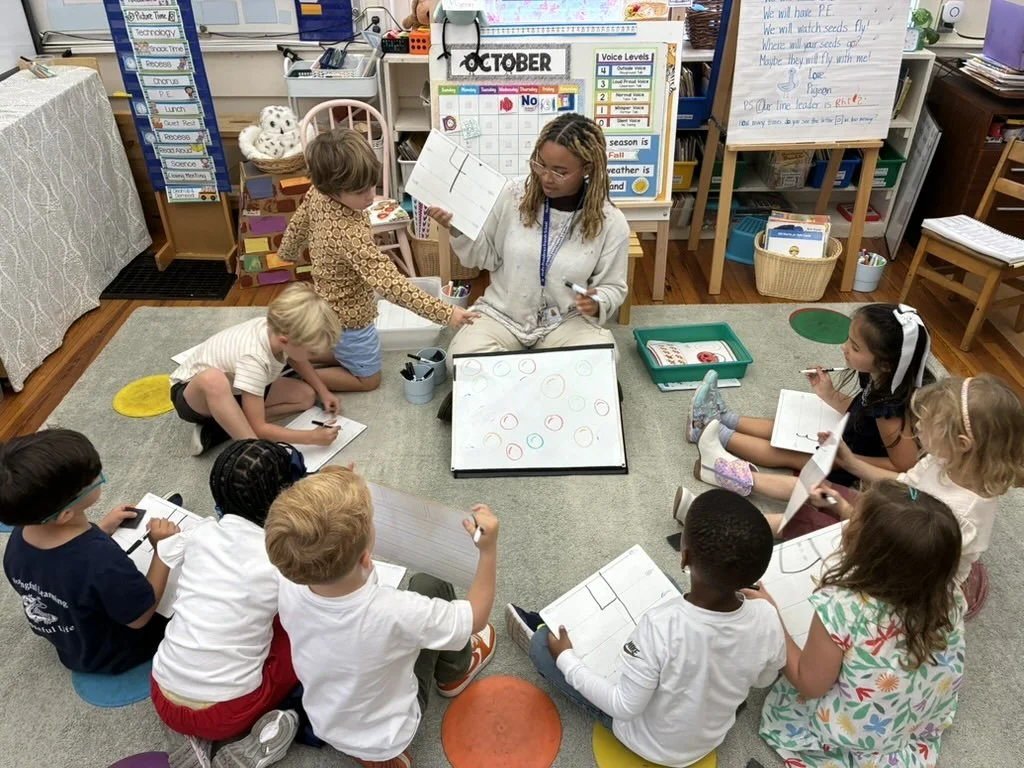
During our Chapter 4 math lessons on comparing numbers to 10, I saw how helpful anchor charts were for building mathematical vocabulary such as “more,” “fewer,” “greater than,” and “less than.” I had students take turns at the board and with the marker, adding faces and demonstrating our strategies (e.g., crossing items out, creating pairs, circular the greater object). When we built the comparison charts together using the drawings but also ten frames and cubes/manipulatives, the students were able to connect the language directly to what they were seeing and doing. This reflected Danielson’s Domain 3, Engaging Students in Learning, because the chart became an interactive part of the lesson rather than something I simply presented to the students.
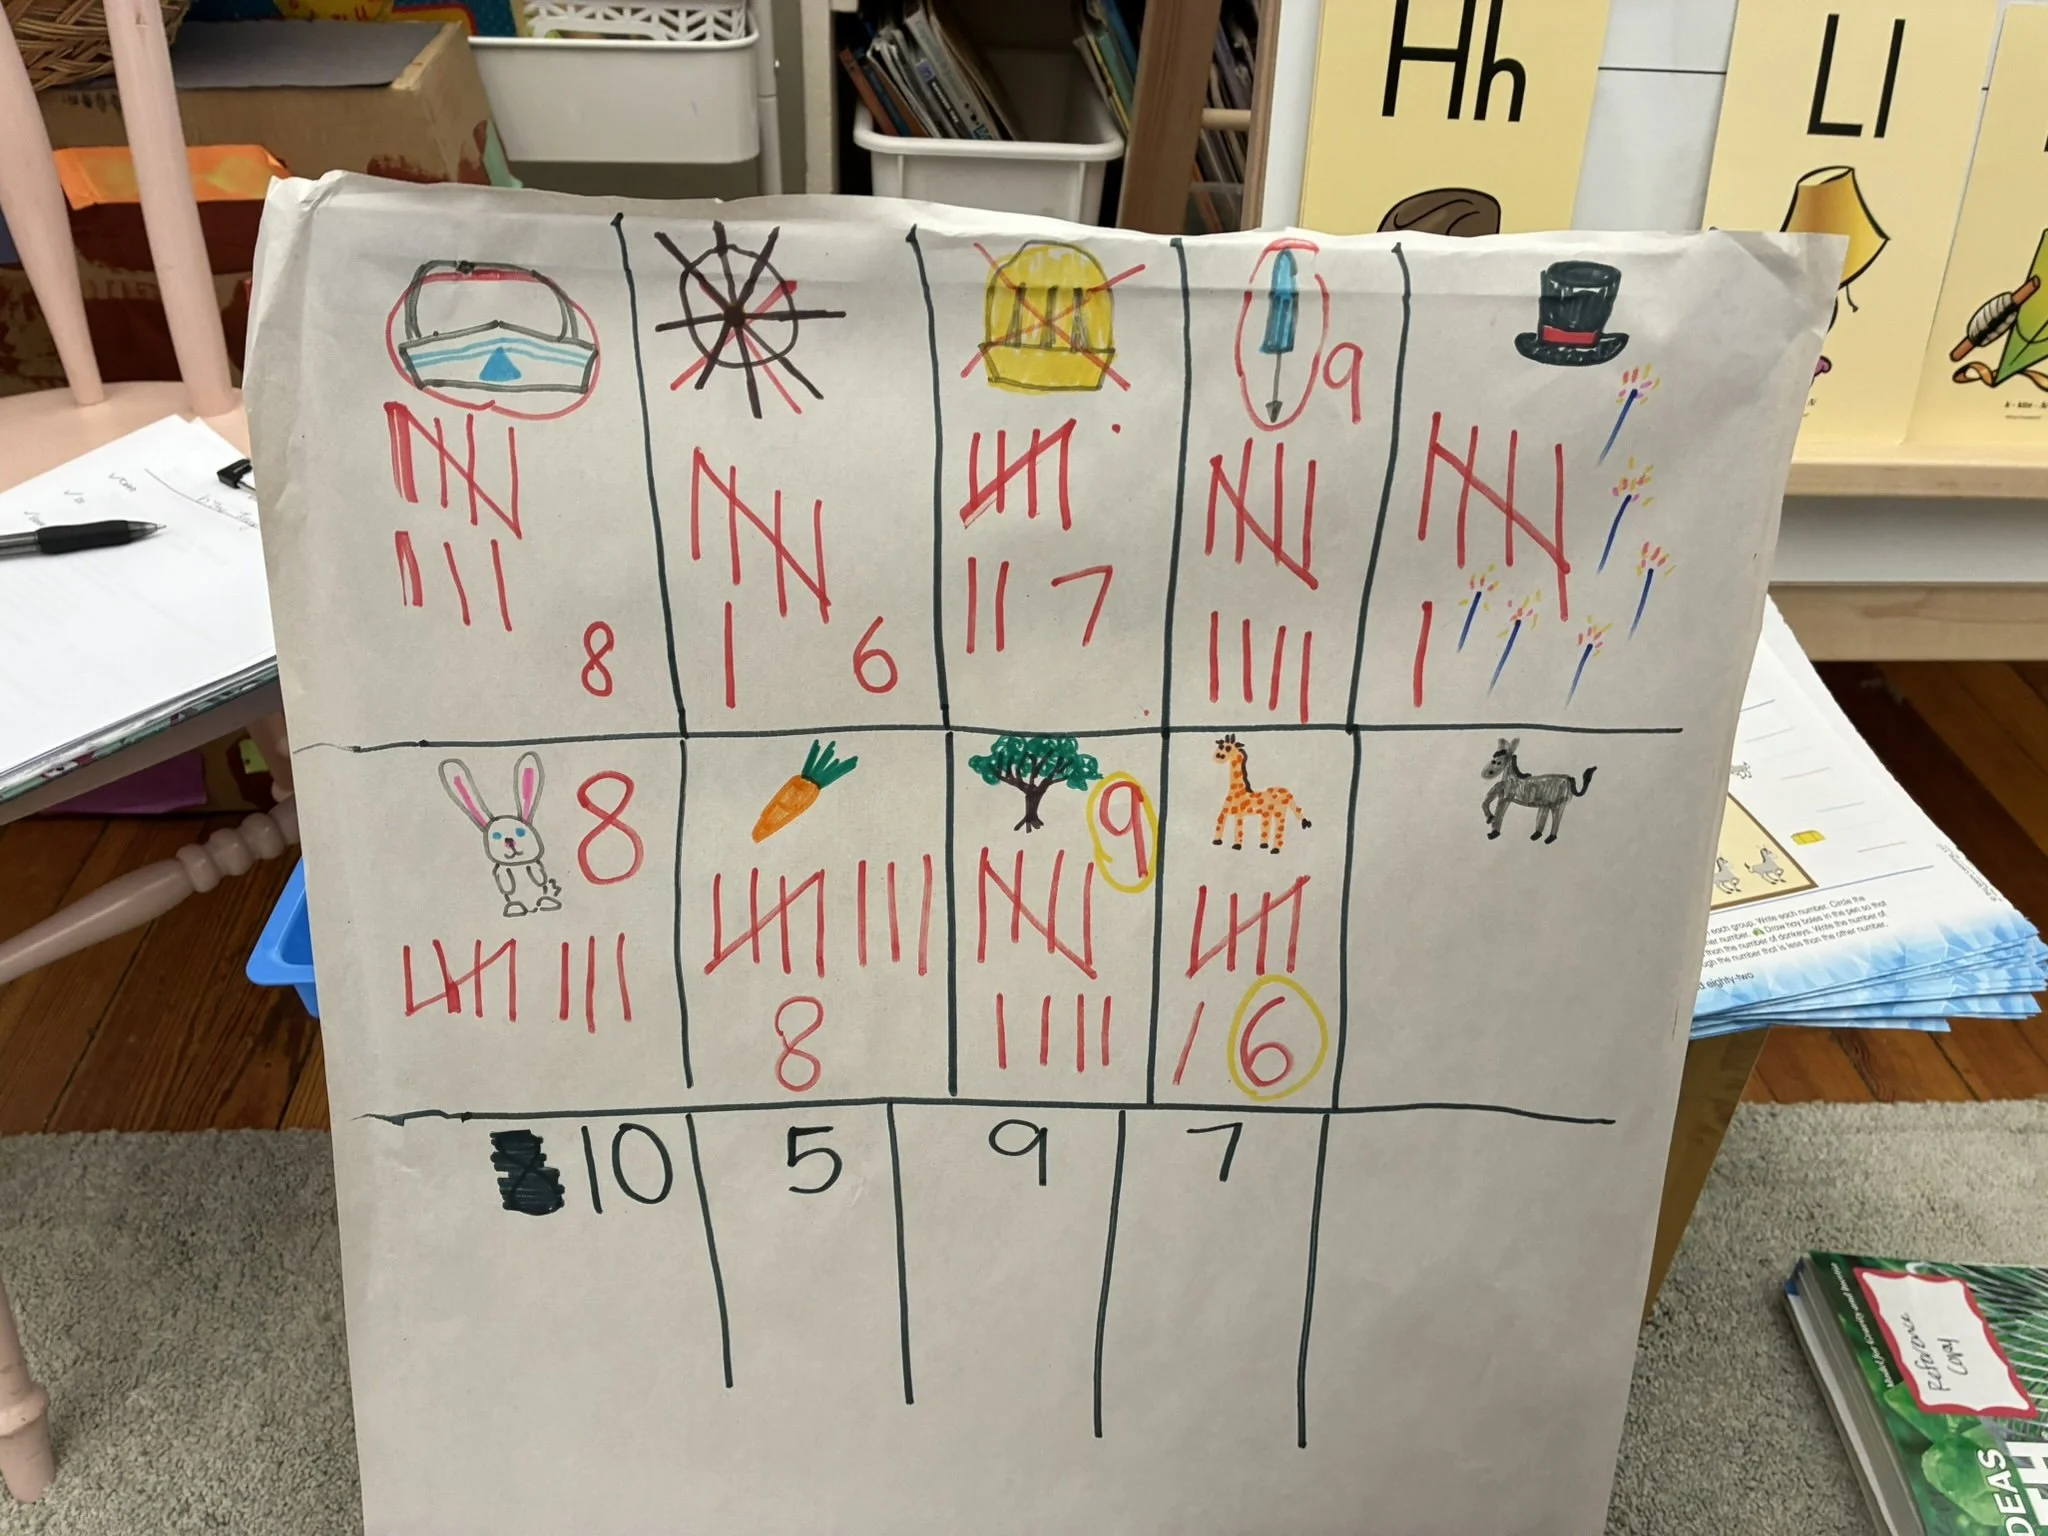
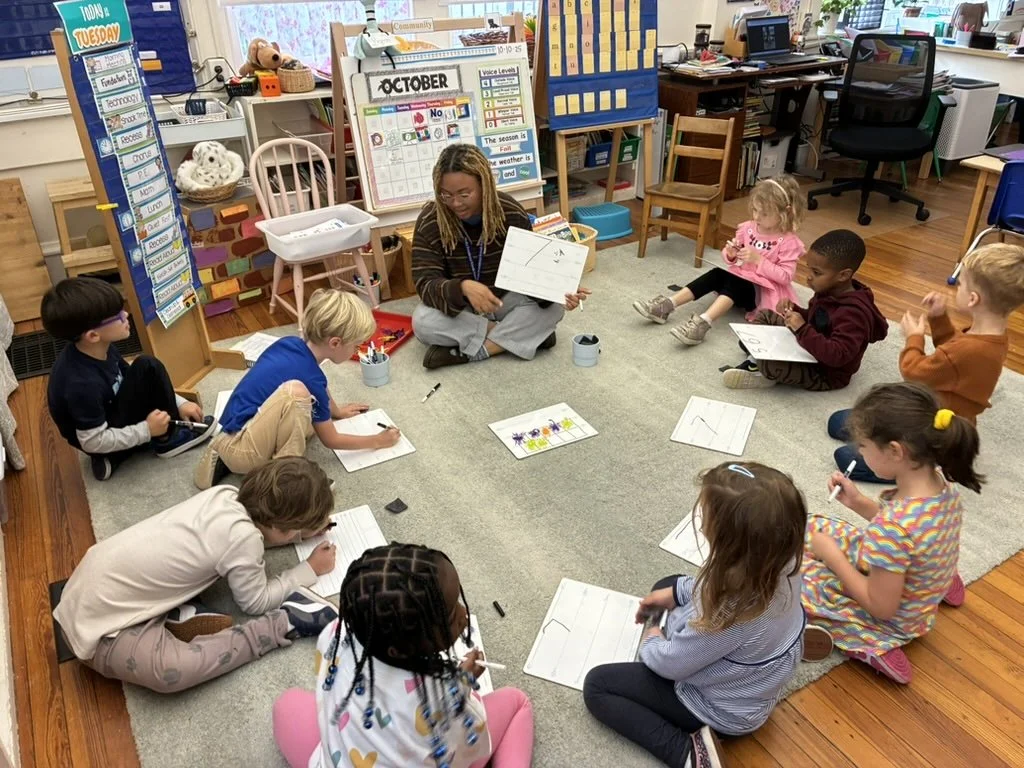
I also noticed that anchor charts helped students connect different lesson structures into one coherent idea. One lesson focused on matching pairs to find equal groups, another on counting and writing numerals, and another on comparing number symbols (e.g., 7>5). Displaying all three representations on one chart helped students recognize that they were all showing the same mathematical concepts in different ways. This connected to Danielson’s Domain 1, Planning and Preparation, because the visual continuity supported deeper conceptual understanding rather than isolated skill practice.
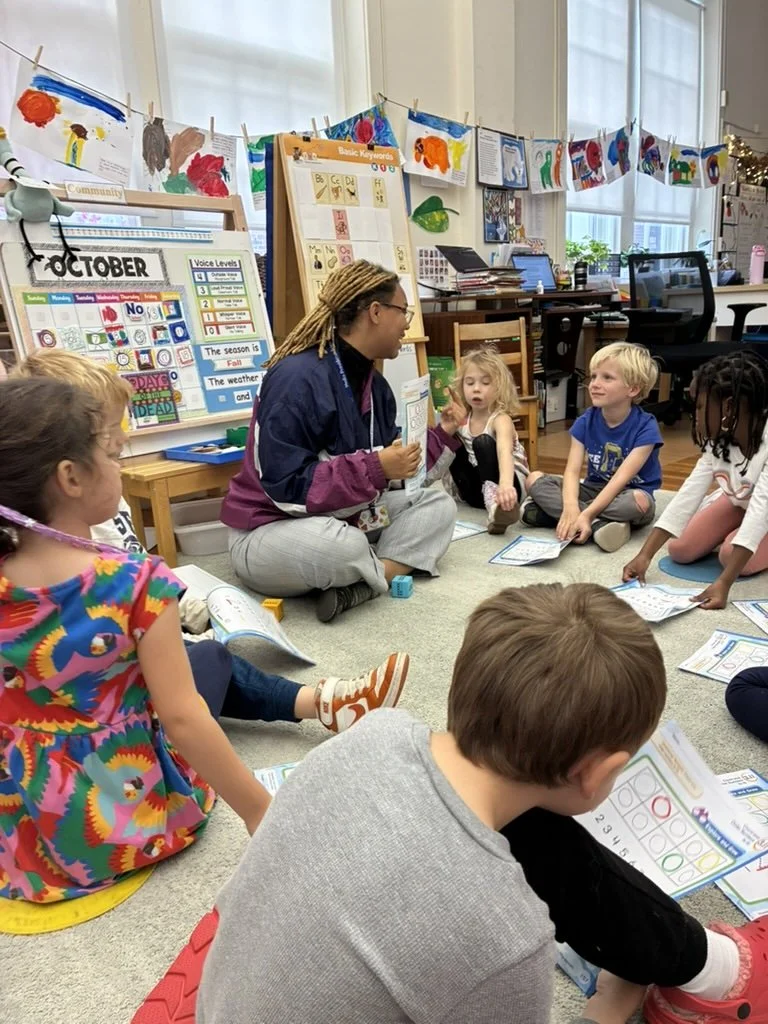
Lastly, one of my favorite parts of using anchor charts was seeing students use them independently during partner work and worksheet time. Students would look back at the chart to check their thinking, often before asking me for help! The chart became a living classroom tool rather than decoration on the wall.